- The Athletic Entrepreneur
- Posts
- The Real Cost of Playing College Ball: Who Actually Pays—and Who Gets Paid
The Real Cost of Playing College Ball: Who Actually Pays—and Who Gets Paid
What families, athletes, and taxpayers need to understand about scholarships, federal aid, and the NIL economy.
Michael Kennedy
April 23, 2026
In partnership with
Rex Gelb spent a decade building HubSpot's paid engine. Now he's showing founders exactly how to do it.
On April 27th, get the framework to structure, launch, and scale paid media that drives pipeline, not just traffic. 20 minutes. Live Q&A. Free.
The pitch sounds simple: play well enough, and college is free.
That’s the marketing.
The reality is a layered financial system — part scholarship, part federal aid, part donor capital, and now part professional compensation structure — that determines who actually gets paid, who gets subsidized, and who quietly absorbs the cost.
This is not just about sports anymore.
It’s about capital allocation.
PART ONE: WHAT A FULL RIDE IS ACTUALLY WORTH
Most conversations about athletic scholarships rely on averages.
That’s the first mistake.
Averages hide the real market.
Let’s look at the actual numbers.
The Top End: Private Power Programs.
At a school like Duke University, the 2025–26 cost of attendance sits roughly between $92,000 and $94,000 per year, depending on student status and budgeting assumptions.
That puts a full-ride scholarship at:
~$92K–$94K per year.
~$370,000+ over four years at current rates.
And that’s before tuition inflation, which has consistently trended upward.
Schools like Stanford, USC, Notre Dame, Vanderbilt, and Wake Forest operate in similar territory.
At the top of the system, a scholarship is not “free school.”
It’s a six-figure asset transfer.
Public Power Programs: The Residency Arbitrage.
Now look at the University of North Carolina at Chapel Hill:
In-state cost of attendance: ~ $28,700/year
Out-of-state cost of attendance: ~ $70,200/year
Same school. Same roster.
Different asset values.
Over four years:
In-state athlete: ~ $115,000
Out-of-state athlete: ~ $280,000
The only difference is geography.
That gap alone reshapes recruiting economics.
Across the Big Ten, SEC, and Big 12, the pattern holds:
In-state full ride: ~$100K–$130K
Out-of-state full ride: ~$200K–$300K
Scholarships are not standardized products.
They are location-based financial instruments.
The Add-Ons That Actually Matter.
The base scholarship is only the visible layer.
Power conference athletes also receive:
Alston academic awards: up to $5,980/year.
Cost-of-attendance stipends: roughly $4,000–$5,700/year
Support infrastructure: medical care, training, travel, tutoring, nutrition.
These aren’t bonuses.
They’re part of the total compensation stack.
The Reality Most Athletes Face:
Fewer than 2% of high school athletes receive any NCAA athletic scholarship.
Most scholarships are partial, not full rides.
Division II and NAIA packages often range from $5K–$15K per year
Division III offers no athletic scholarships at all.
The “full ride” narrative is the exception.
Not the system.
And all of this describes the pre-2025 model — before the structure itself changed.
PART TWO: FEDERAL MONEY
Scholarships don’t operate in isolation.
They sit inside a broader funding system that includes federal dollars.
The Pell Grant Layer.
For 2025–26, the maximum federal Pell Grant is $7,395.
It’s need-based. It doesn’t get repaid.
And for many athletes, it’s the difference between surviving and struggling.

Under NCAA rules, Pell Grants can be stacked on top of scholarships, as long as total aid doesn’t exceed cost of attendance.
That means:
Partial scholarship athletes use Pell to close the gap.
Full-ride athletes often receive it as usable cash.
This is one of the most important — and least discussed — funding layers in college sports.
The Policy Shift Coming in 2026.
A provision in H.R. 1 (2025 reconciliation bill) changes that structure.
Starting July 1, 2026:
Any student receiving non-federal aid equal to full cost of attendance becomes ineligible for Pell Grants.
Translation:
Full-ride athletes lose access to federal grant money.
This hits unevenly.
Data shows roughly 69% of Black male scholarship athletes receive Pell Grants, compared to lower rates across the general student population.
At the same time, NIL earnings remain highly skewed.

PART THREE: THE HOUSE SETTLEMENT — THE SYSTEM RESET
Everything changed with House v. NCAA.
Approved in June 2025, the settlement introduced a new financial structure:
Back Pay
$2.8 billion distributed to roughly 184,000 former athletesRevenue Sharing
Schools can pay athletes directly
Cap: $20.5M per school (2025–26)
Projected to rise toward ~$33M by the mid-2030sScholarship Caps Removed
Replaced by roster limits
More flexibility, but not more equal distribution
This wasn’t a tweak.
It was a market reset.
PART FOUR: NIL — WHERE THE MONEY ACTUALLY FLOWS
NIL was sold as access.
In reality, it created stratification.
The Real Distribution
Data shows:
Average NIL earnings in football and basketball: ~ $38,000
Median earnings: ~ $1,300
That gap tells the story.
A small percentage of athletes capture the majority of value.
Most receive very little.
The New Allocation Strategy
Schools are now combining:
Scholarships
NIL collectives
Direct revenue sharing
Example:
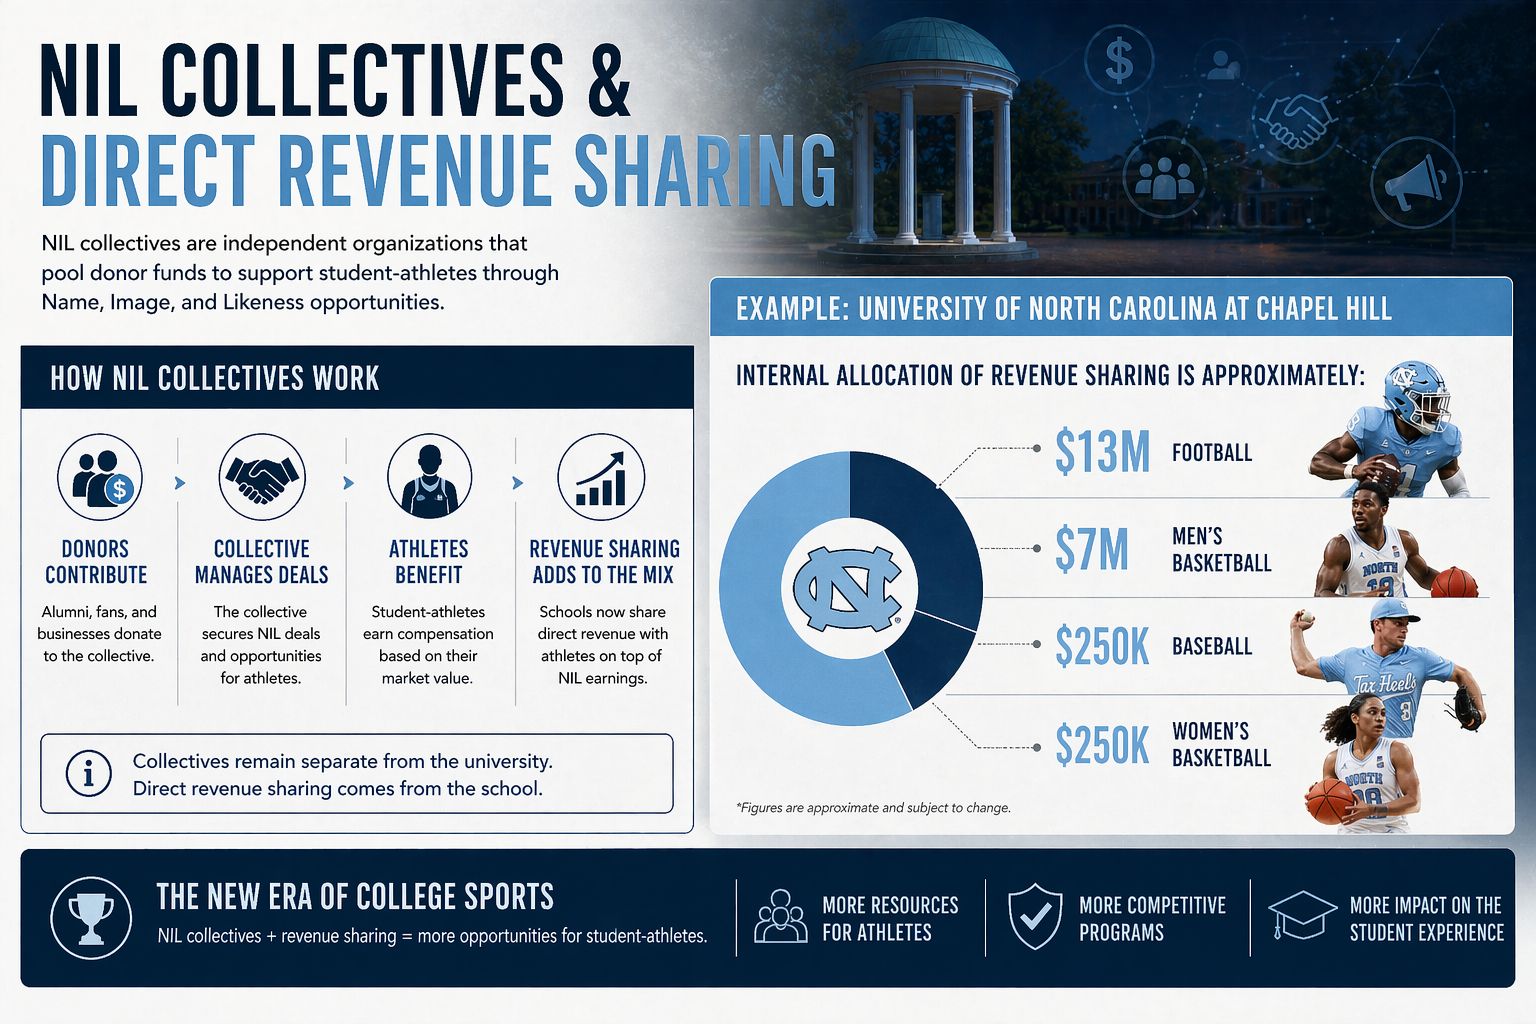
At the University of North Carolina at Chapel Hill, internal allocation of revenue sharing is approximately:
$13M to Football
$7M to Men’s Basketball
$250K to Baseball
$250K to Women’s Basketball
This mirrors revenue generation.
Not participation.
The Outcome
NIL didn’t level the system.
It formalized it.
Top-tier programs operate like pro franchises
Mid-tier athletes operate in a fragmented market
Non-revenue sports fight for residual capital
This is no longer an educational model.
It’s a tiered compensation economy.
PART FIVE: THE FEDERAL GOVERNMENT ENTERS THE SYSTEM

On April 3, 2026, Donald Trump signed an executive order titled:
“Urgent National Action to Save College Sports”
Key components:
Applies to schools with $20M+ in athletics revenue.
Takes effect August 1, 2026.
Directs federal agencies to evaluate athletic compliance when awarding grants and contracts.
This matters because universities depend heavily on federal funding.
Not for athletics directly —
but for the ecosystem that supports them.
The leverage point isn’t sports.
It’s funding eligibility.
PART SIX: THE SCOREBOARD
Here is the reality:
A full ride at a top program is now a $100K to $370K+ asset, depending on school and residency.
But fewer than 2% of athletes ever receive one.
Federal Pell Grants quietly support a large percentage of athletes —
and that support is now being reduced.
The House settlement introduced direct pay, but didn’t equalize distribution.
NIL created upside —
but concentrated it at the top.
And the federal government has now positioned itself as a governance layer in college sports through funding leverage.
WHAT THIS ACTUALLY MEANS
College athletics is no longer one system.
It’s three overlapping economies:
Scholarship economy (education funding)
Federal aid economy (Pell + institutional support)
Market economy (NIL + revenue sharing)
Most athletes operate in all three simultaneously.
Very few control any of them.

© 2026 The Athletic Entrepreneur Newsletter